Code to Cloud · Notes
10 — Testing Strategy & Documentation
Lecture slides and notes for 10 — Testing Strategy & Documentation from the Notes module in Code to Cloud by Md Ahbab. 13 pages.
Content Preview
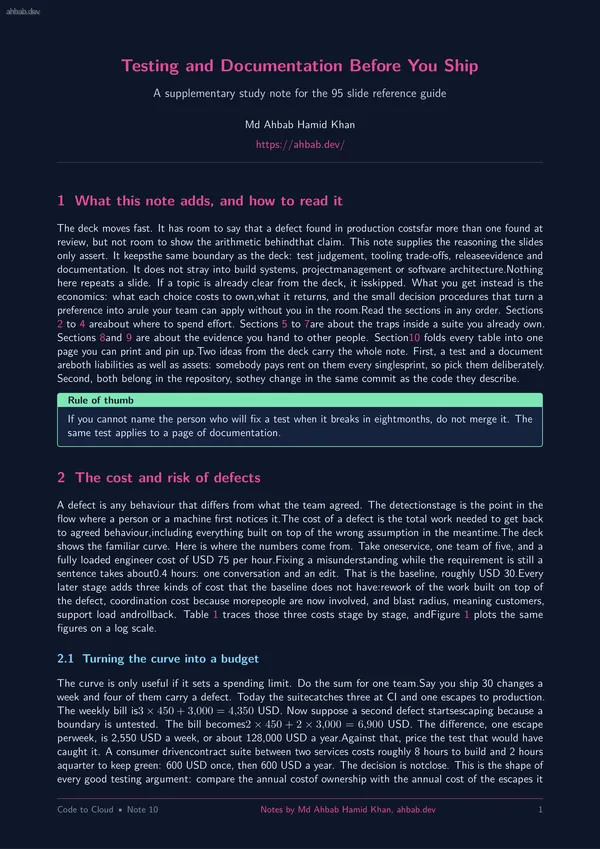
Testing and Documentation Before You Ship A supplementary study note for the 95 slide reference guide Md Ahbab Hamid Khan https://ahbab.dev/ 1 What this note adds, and how to read it The deck moves fast. It has room to say that a defect found in production costsfar more than one found at review, but not room to show the arithmetic behindthat claim. This note supplies the reasoning the slides only assert. It keepsthe same boundary as the deck: test judgement, tooling trade-offs, releaseevidence and documentation. It does not stray into build systems, projectmanagement or software architecture.Nothing here repeats a slide. If a topic is already clear from the deck, it isskipped. What you get instead is the economics: what each choice costs to own,what it returns, and the small decision procedures that turn a preference into arule your team can apply without you in the room.Read the sections in any order. Sections 2 to 4 areabout where to spend effort. Sections 5 to 7are about the traps inside a suite you already own. Sections 8and 9 are about the evidence you hand to other people. Section10 folds every table into one page you can print and pin up.Two ideas from the deck carry the who
Table 1: Detection stage against the work needed to fix, for one service team.Costs assume USD 75 per hour. The relative column is the multiple of therequirements stage baseline of 0.4 hours. Detection stage Hours Cost (USD) Relative What drives the cost Requirements 0.4 30 1× One conversation, one edit Design 1.2 90 3× Redraw an interface, re-agree it Coding, caught locally 2.4 180 6× Context switch, rerun the suite Code review 3.2 240 8× Two people, a round trip, a rebase CI integration 6.0 450 15× Branch conflicts, other work stacked on top System QA 16.0 1,200 40× Report, triage, retest, sign off Staging or UAT 24.0 1,800 60× Release slip, cross team coordination Production 40.0 3,000 100× Incident, rollback, support, trust Production with data loss 120.0 9,000 300× Repair, backfill, disclosure, audit Requirements Design Code Review CI QA Staging Production 100 101 102 Stage where the defect is first seen Relative cost to fix, log scale Ordinary service defect Defect that corrupts customer data Figure 1: The cost curve from Table 1. A straight line on a logaxis means the cost multiplies at each stage rather than adding. The upper lineshows why data integrity bugs deserve the mo
prevents, and refuse toargue about anything else. Common trap Quoting the 100 times figure as if it were a law of nature. It is a shape, not aconstant. Measure the only two numbers that matter for your team: median hoursto fix a defect caught in CI, and median hours to fix one caught in production.The ratio between them is your curve, and it is usually between 8 and 40. 3 The shape of a suite The pyramid says: many small unit tests at the base, fewer integration tests inthe middle, a handful of end to end tests at the top. A unit test checks onepiece of code in isolation. An integration test checks two or more real piecestalking to each other. An end to end test drives the whole system the way a userdoes. The trophy keeps the same layers but changes the proportions: a wide baseof static analysis and type checking, a thinner unit layer, a fat integrationlayer, and a very small end to end cap. Figure 2 shows both.The trophy displaced the pyramid for service heavy code for three concretereasons, all of them cost reasons. 1. Most service code is glue. The risk does not live inside a pure function, it lives at the boundary: serialisation, SQL, HTTP status codes, retries, timeouts, autho
Other Documents in Notes
- 1 — Software Architecture & System Design
- 2 — Backend Engineering Across Frameworks
- 3 — Frontend Engineering & the Browser Layer
- 4 — Databases, Storage & the Data Layer
- 5 — AI Integration, Model Serving & Agentic Systems
- 6 — Containers, Docker & Kubernetes
- 7 — Cloud Infrastructure, VMs & Server Operating Systems
- 8 — Networking, Domains, TLS, CDN & Security